Exploring complex data visualizations from wordwide trending topics!
Trending now
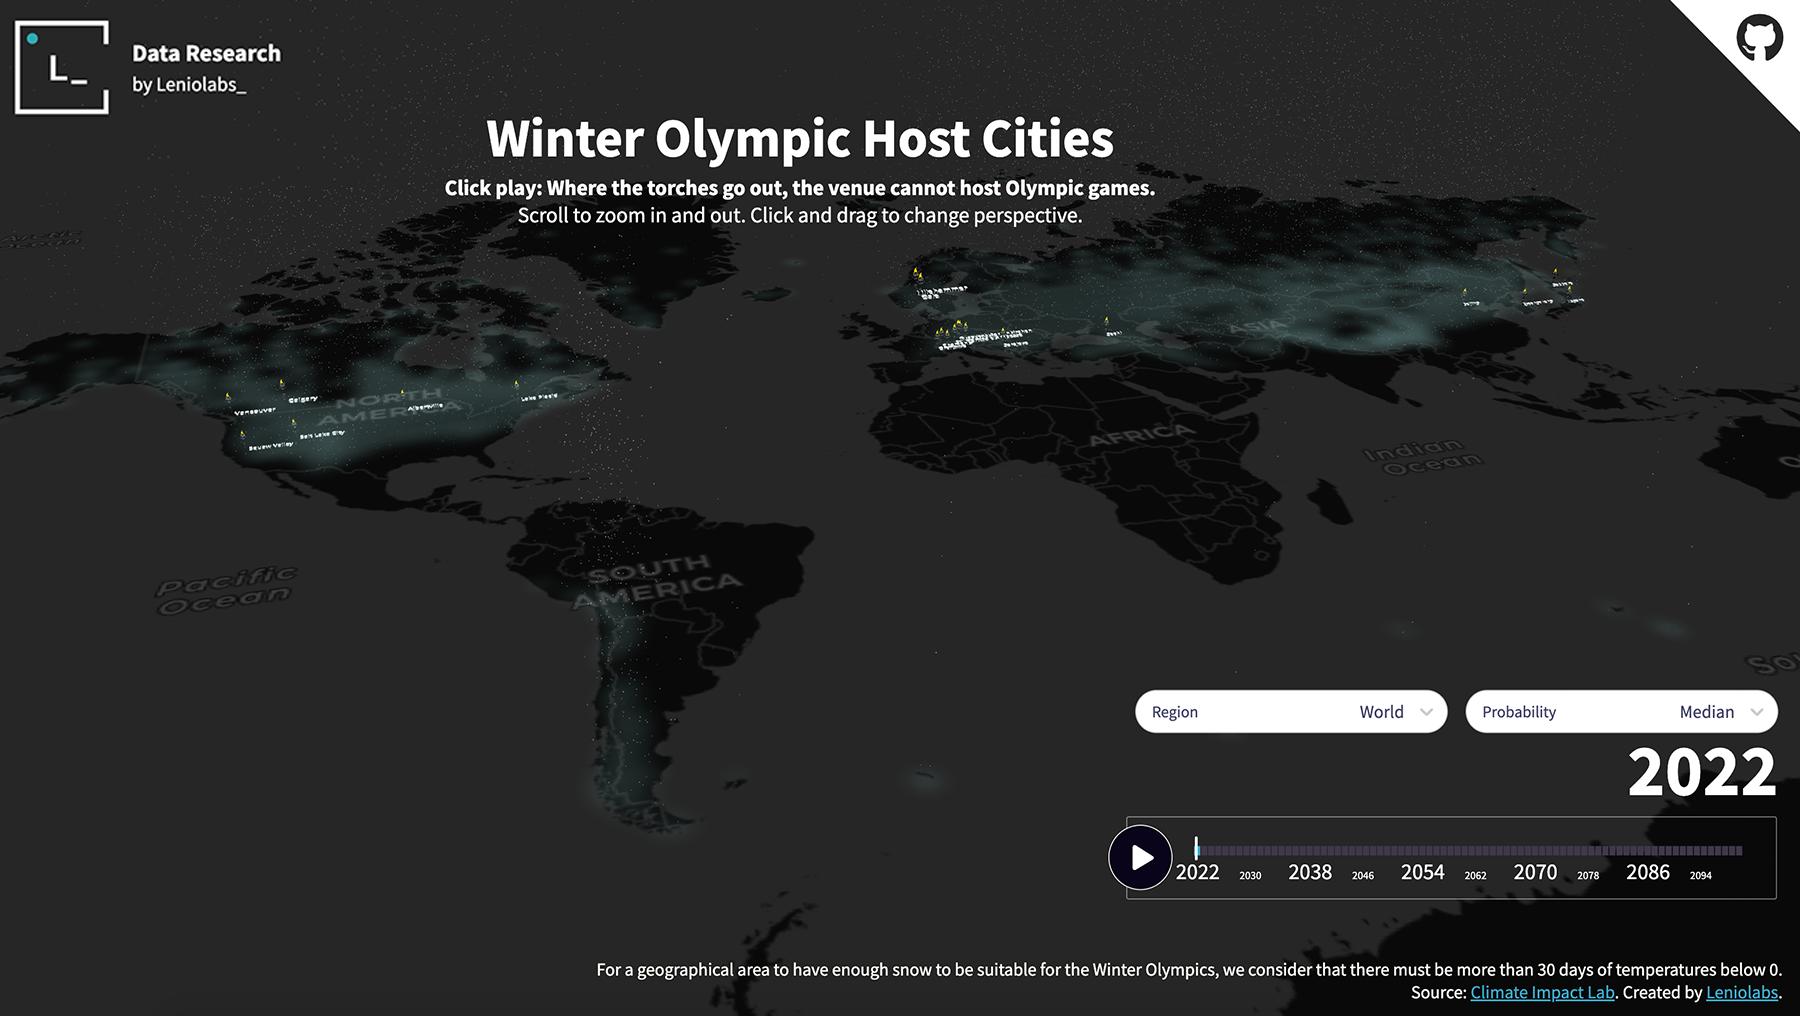
Winter Olympic Cities
February 18, 2022Interactive map with cities where climate change will not allow future winter Olympics to happen.
Explore Data VisualizationWinter Olympics
February 8, 2022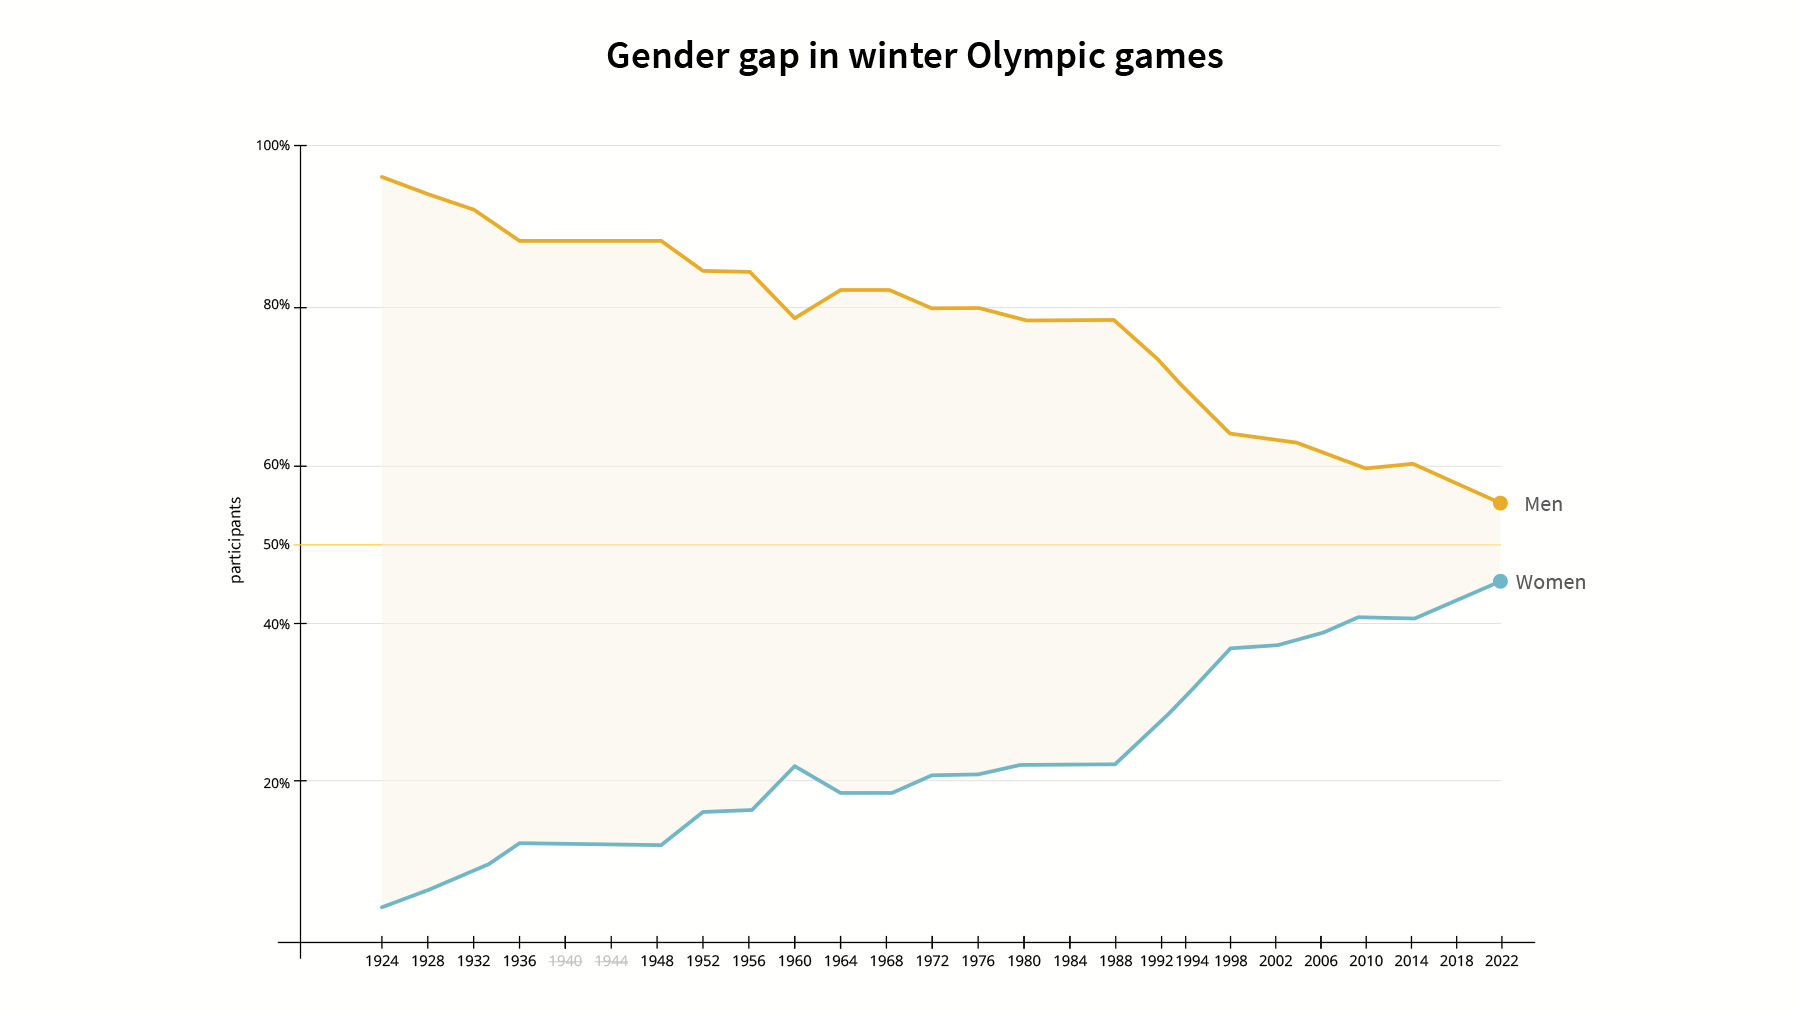
Data visualizations of Gender Gap in Winter Olympic Games from 1924 to 2022, and list of sports by gender year by year.
Explore Data VisualizationAmazon Deforestation
October 20, 2021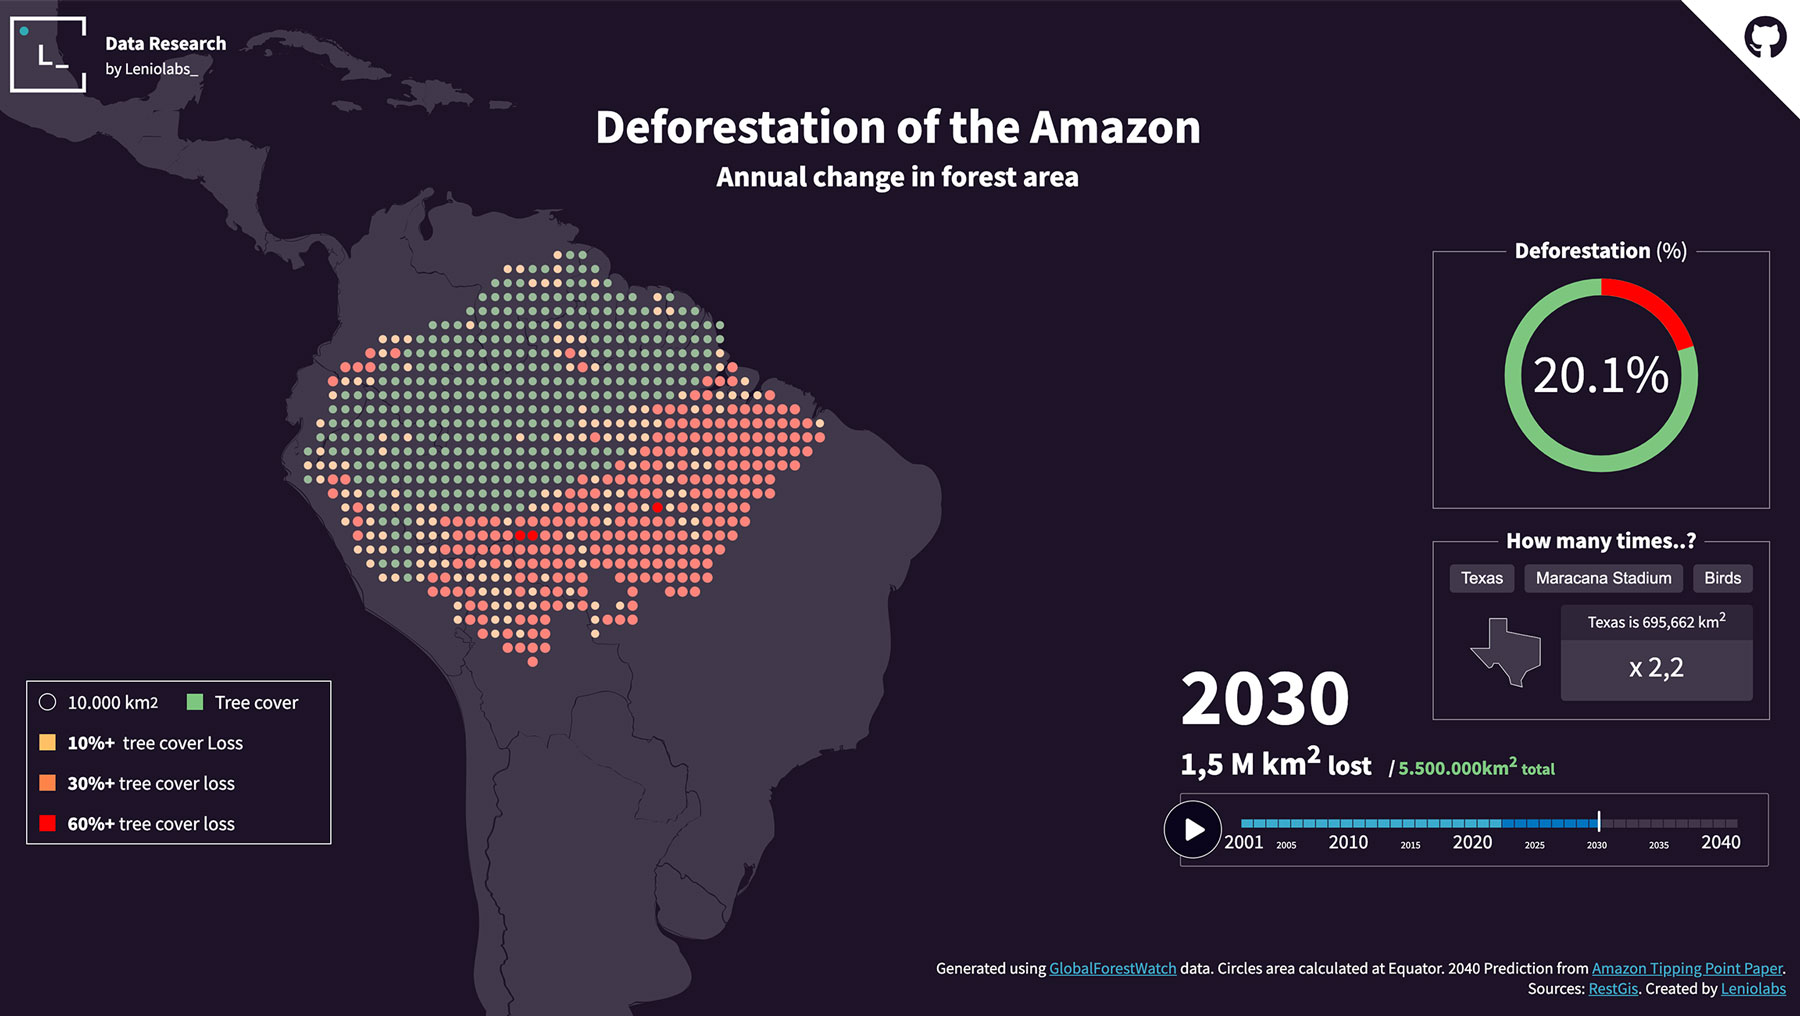
Data visualizations of Deforestation of Amazon. We created a timeline animations of deforestation area in Amazon year by year from 2020 and a progression up to 2040.
Explore Data VisualizationParalympics
September 7, 2021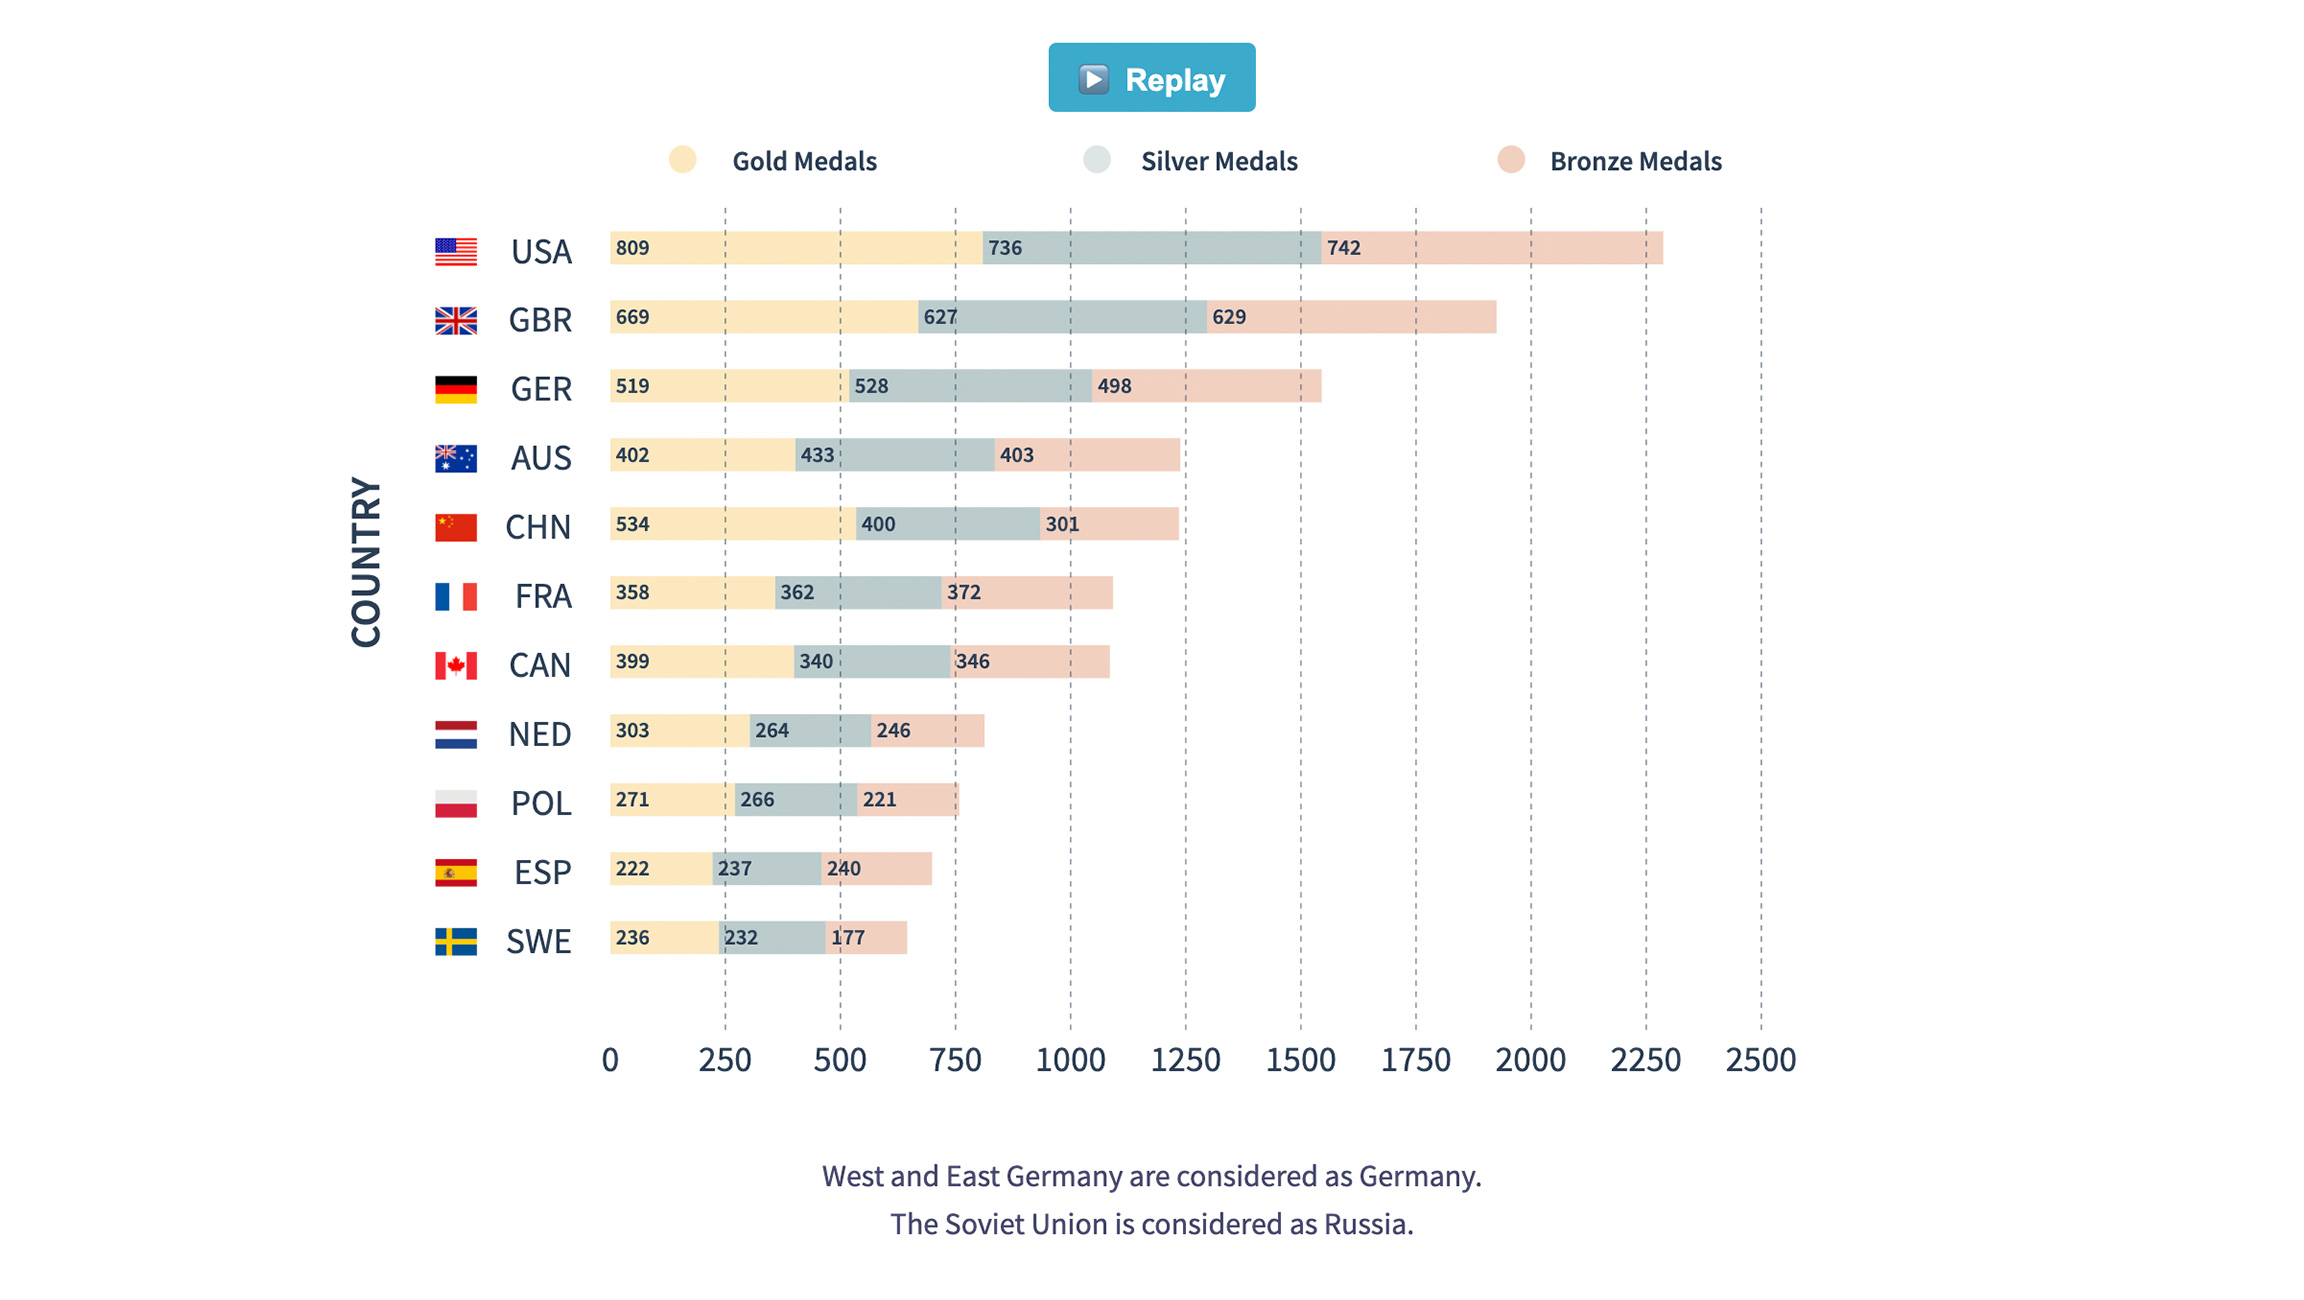
Data visualizations of Paralympics. We created a timeline animations of Top countries with Paralympics medals year by year, including Tokyo 2020.
Explore Data VisualizationWomen in Tech
August 19, 2021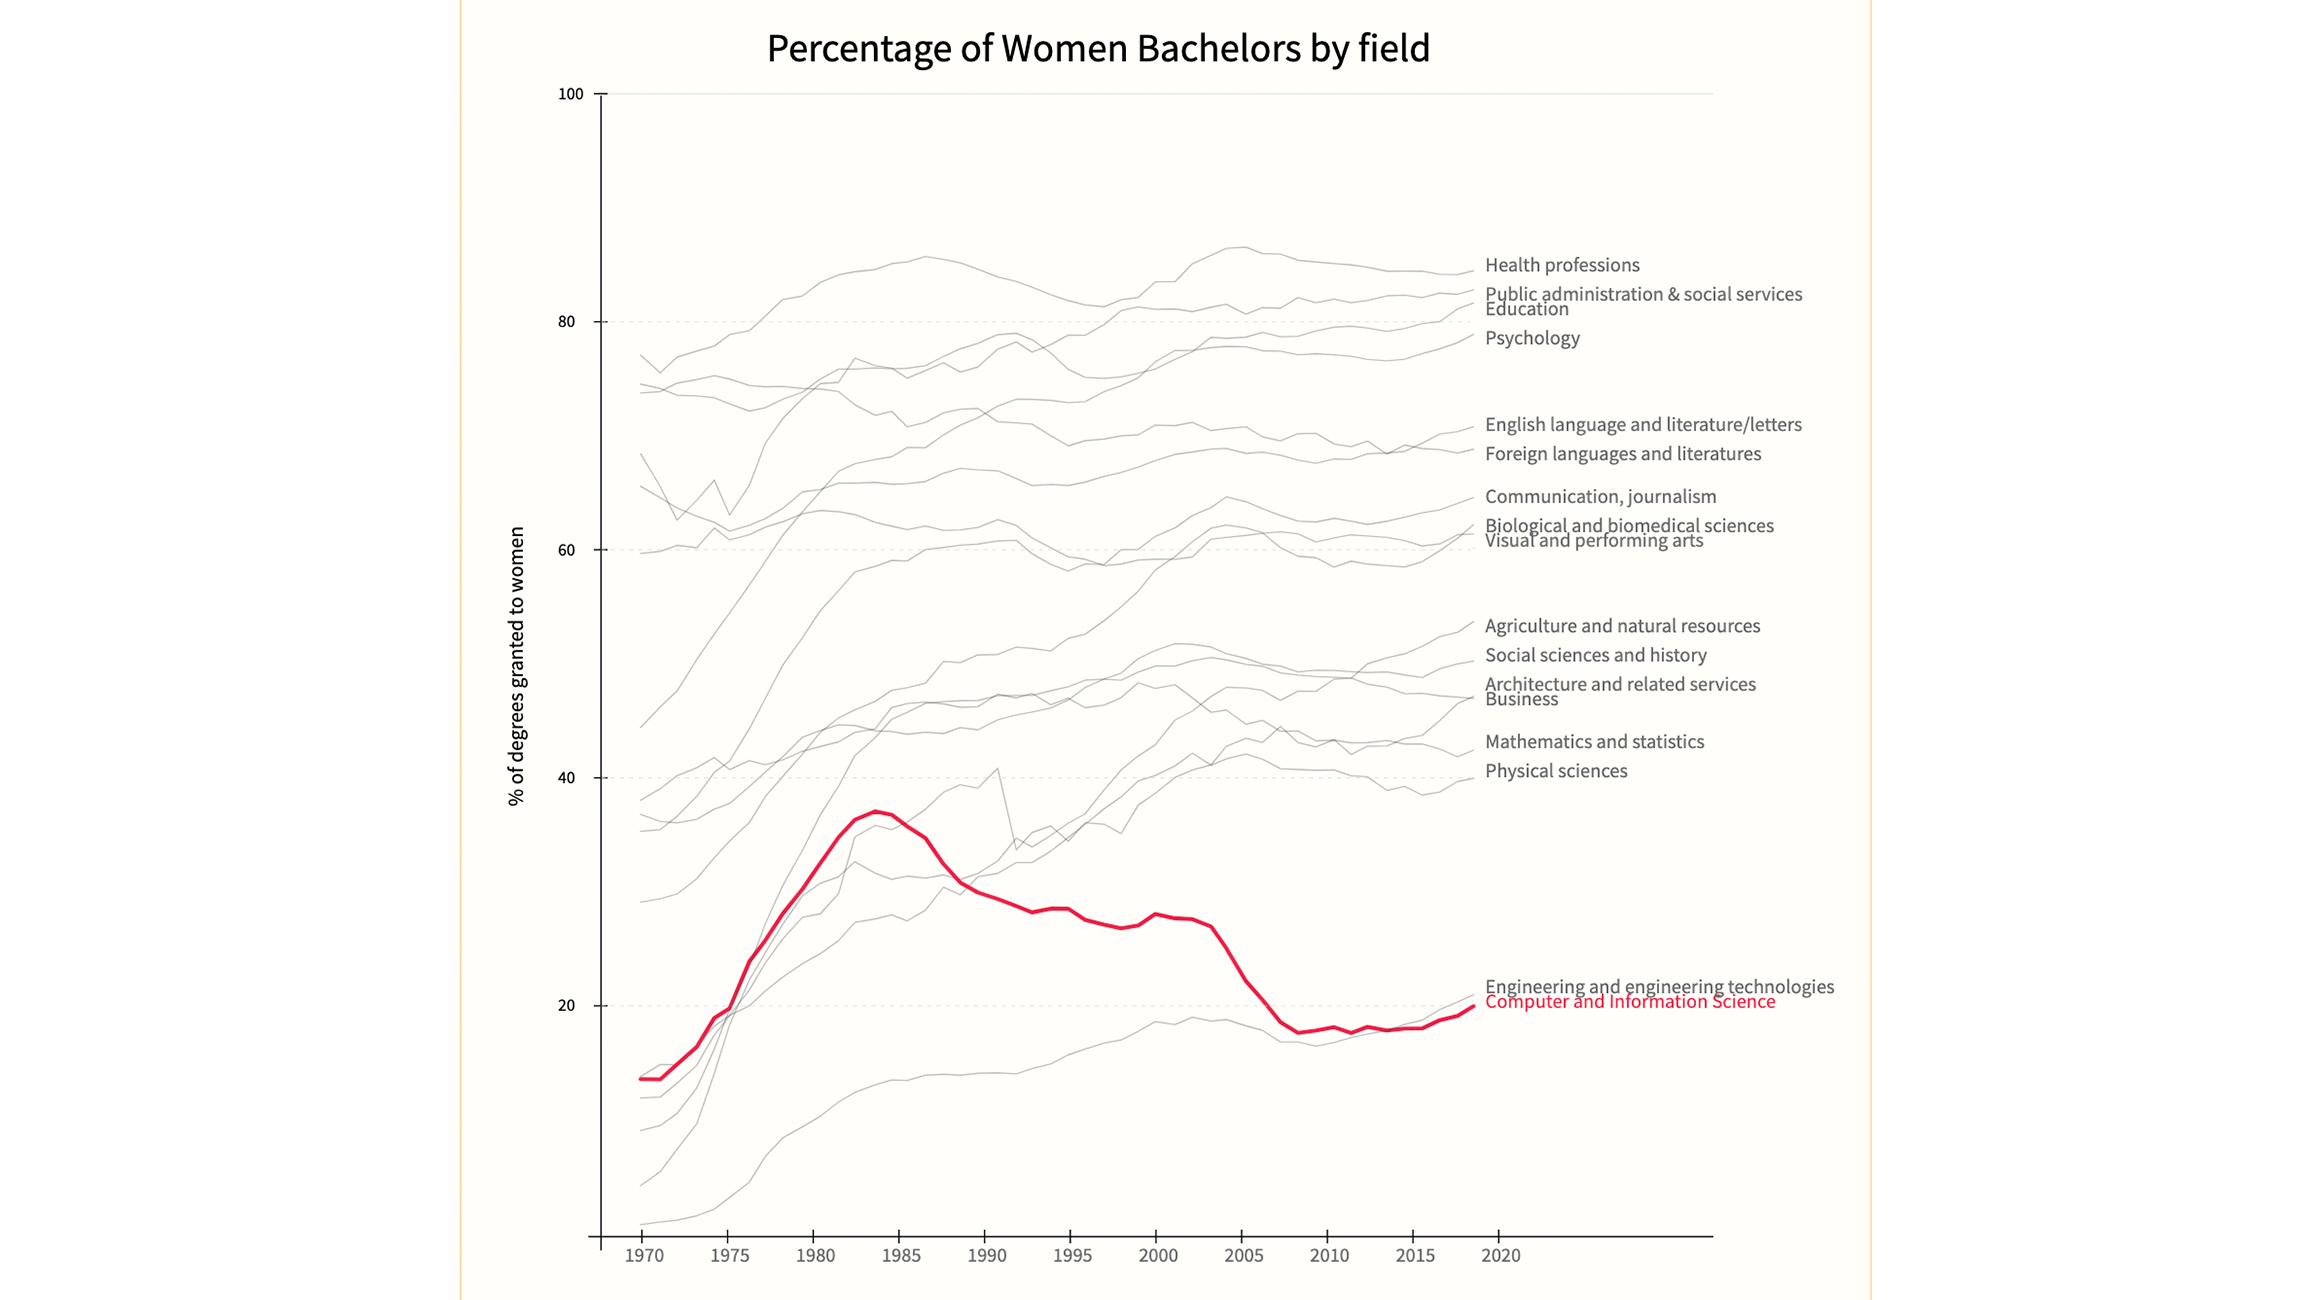
Why did women stop coding? Digging deep into data sources from the National Center for Education Statistics, you find a steep drop in women’s bachelor degrees since 1984 that doesn’t seem to recover. Read this research to find out why.
Explore Data VisualizationOlympics
August 12, 2021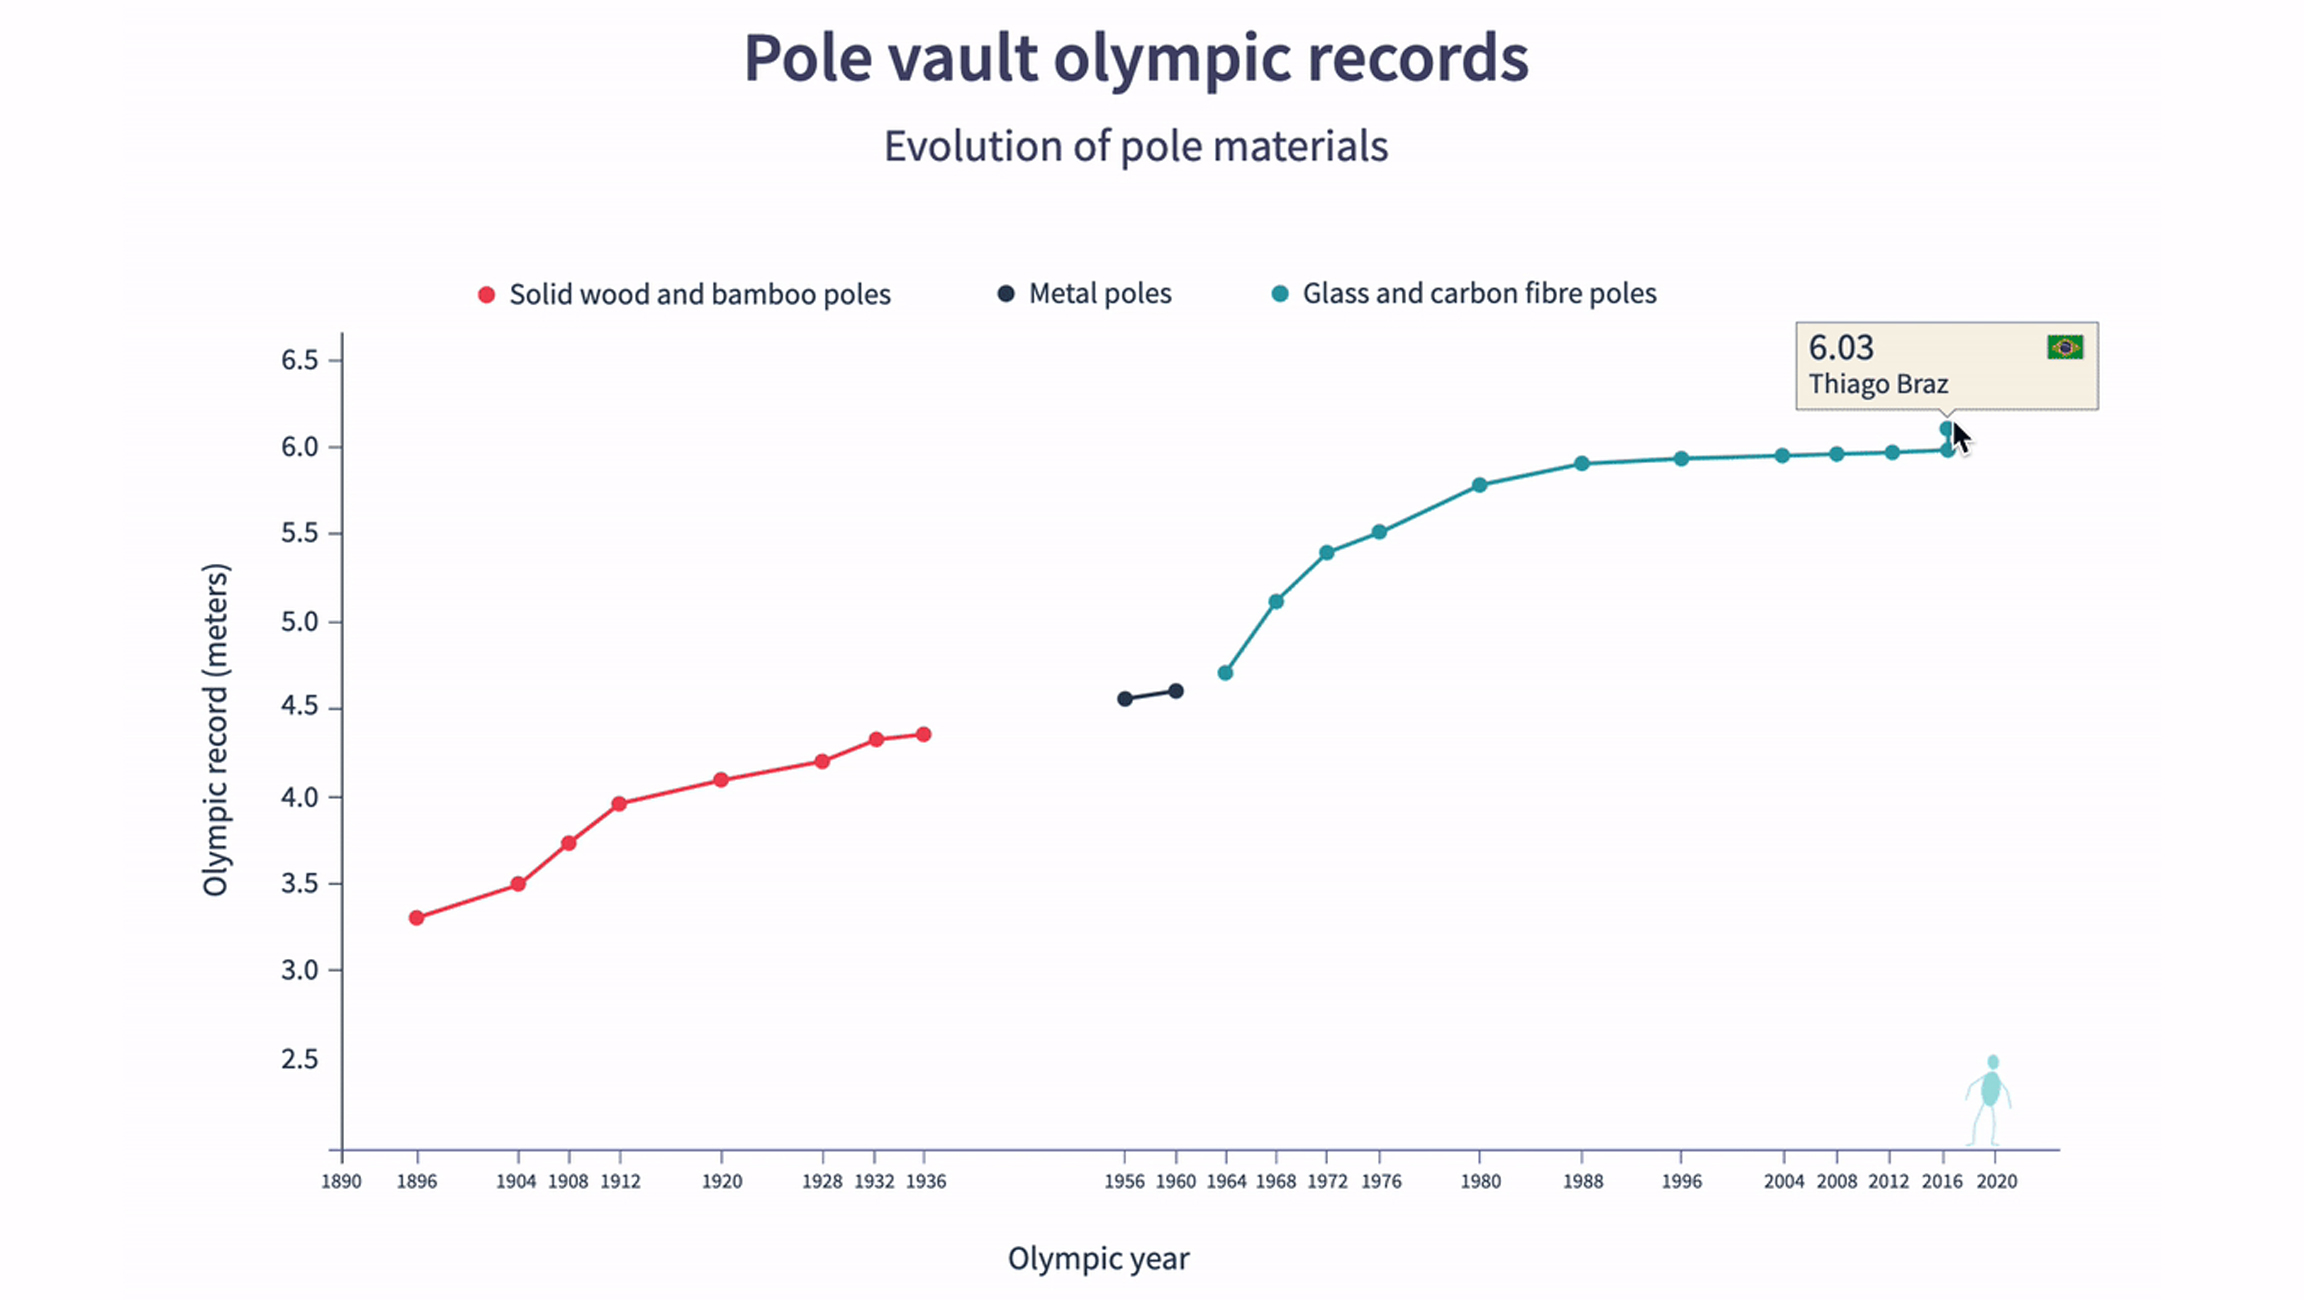
Two data visualizations of Olympics. We analyzed how materials and technology had an impact on Pole Vault, comparing Olympic records with each pole material. And we created a timeline animations of Top countries with Olympic medals year by year.
Explore Data VisualizationHousing Market
July 20, 2021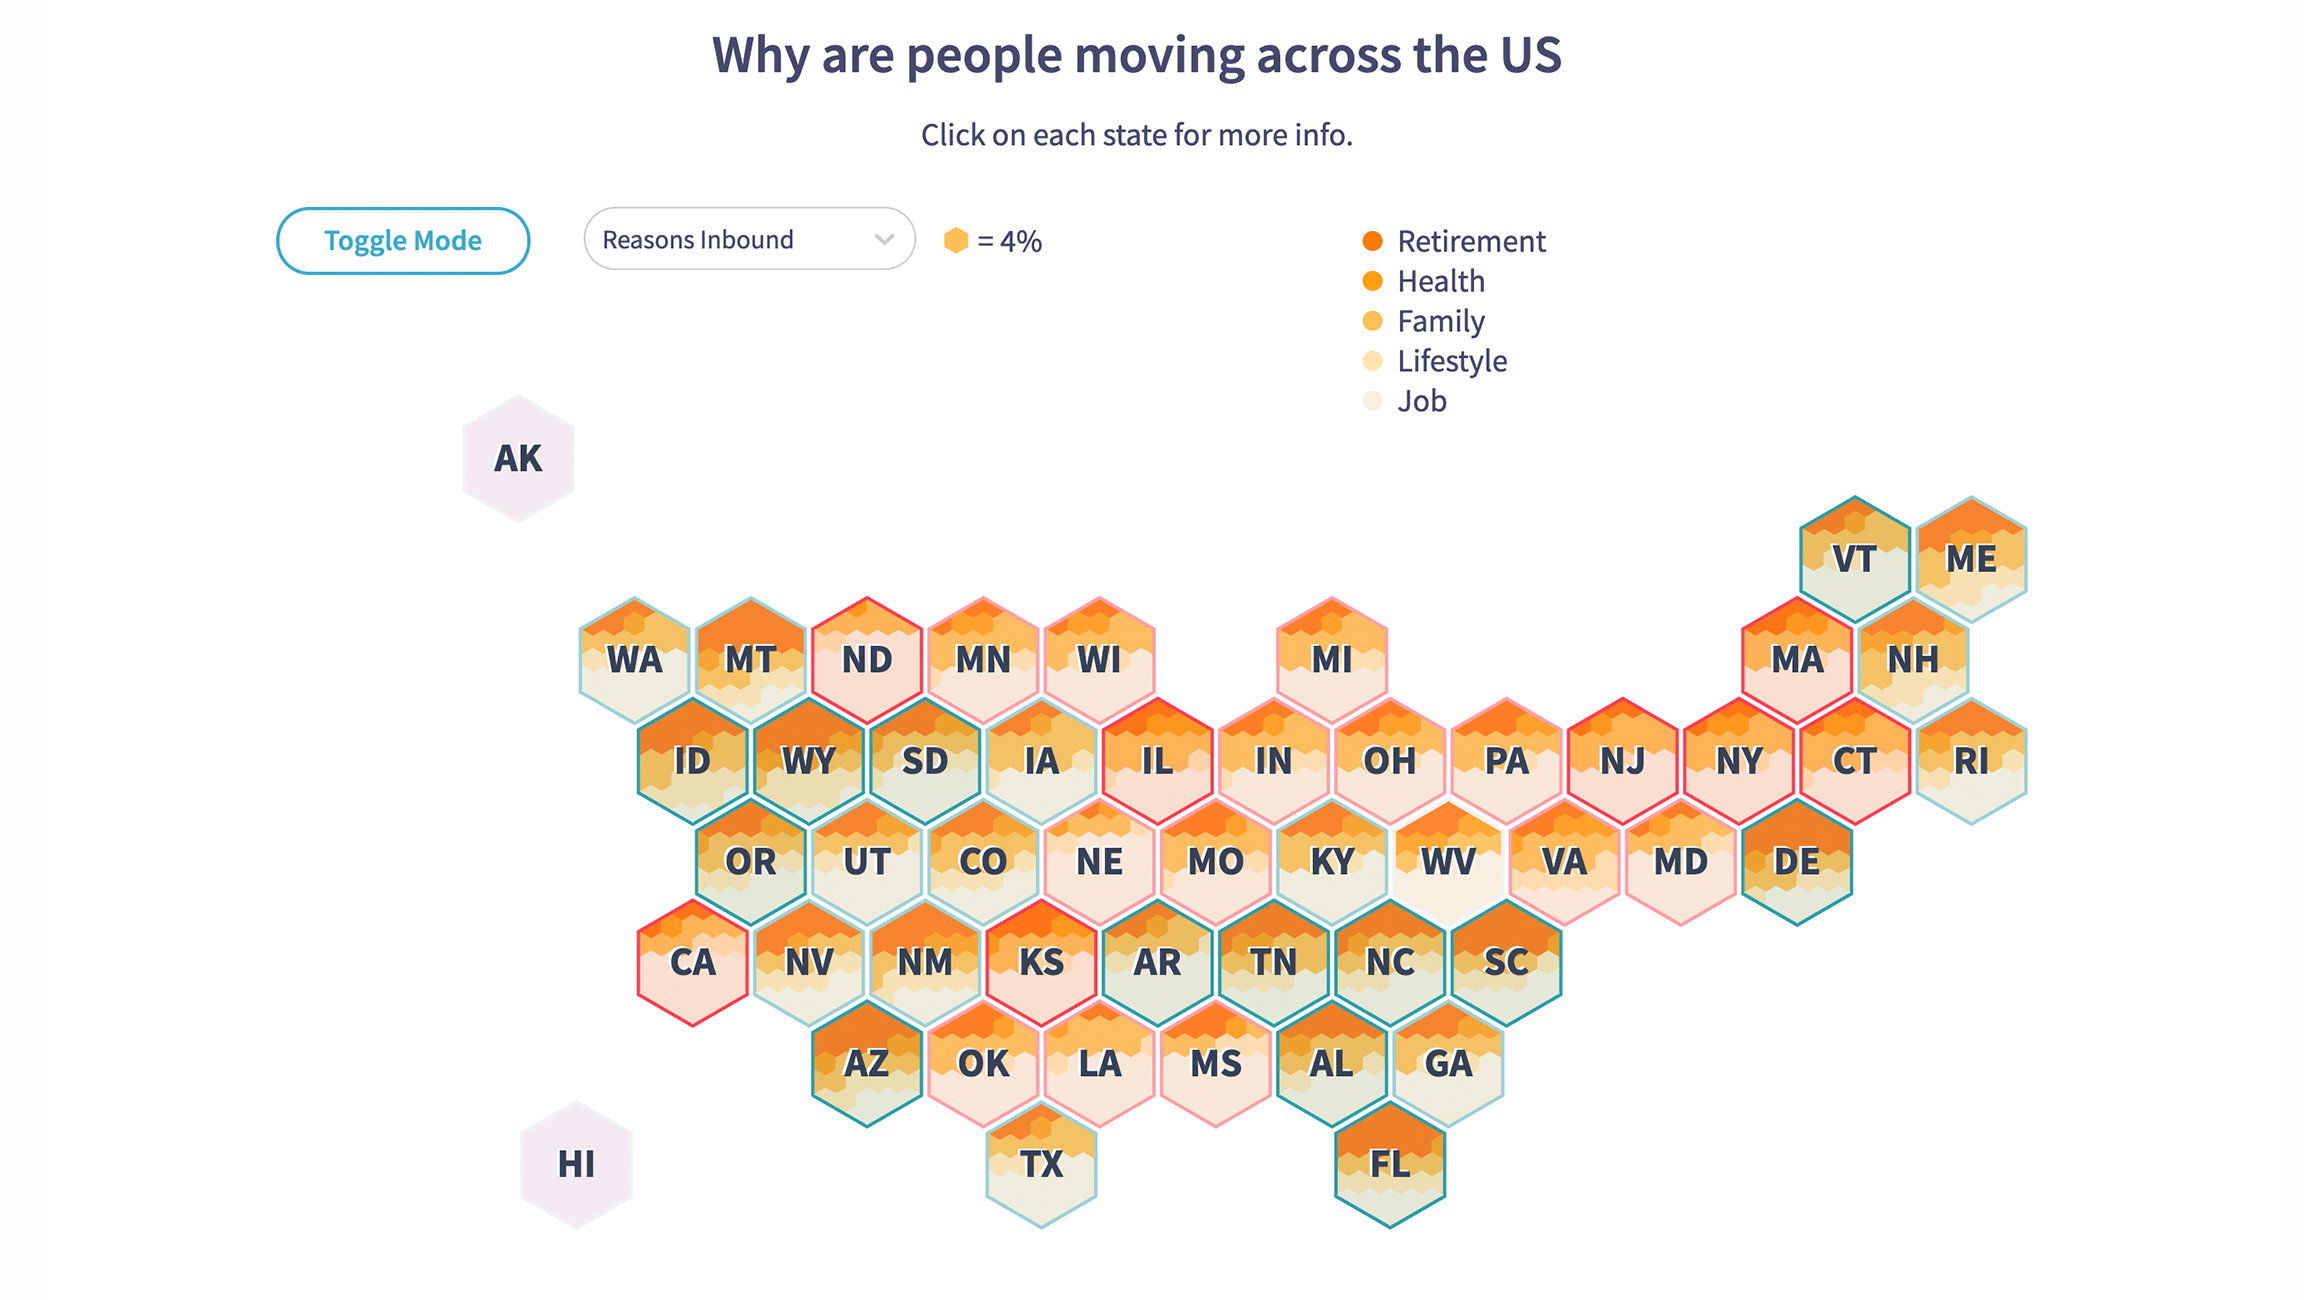
The housing market is witnessing an evolution with many housing trends accelerating by 5–10 years. States like Texas, Idaho, Florida, and Wyoming are witnessing unprecedented growth in the housing market as an increasing number of families move there.
Explore Data VisualizationTimeline
June 30, 2021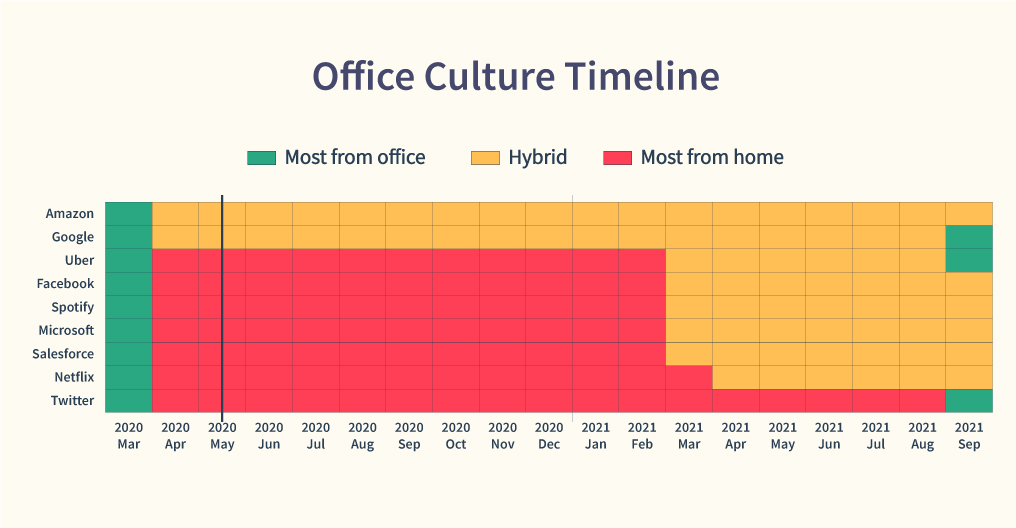
How the pandemic shaped the office culture. We analyzed the tweets and news from top tech companies to compare how they adapted their office culture to the pandemic crisis from May 2020 until today.
Explore Data VisualizationSpace flight
April 12, 2021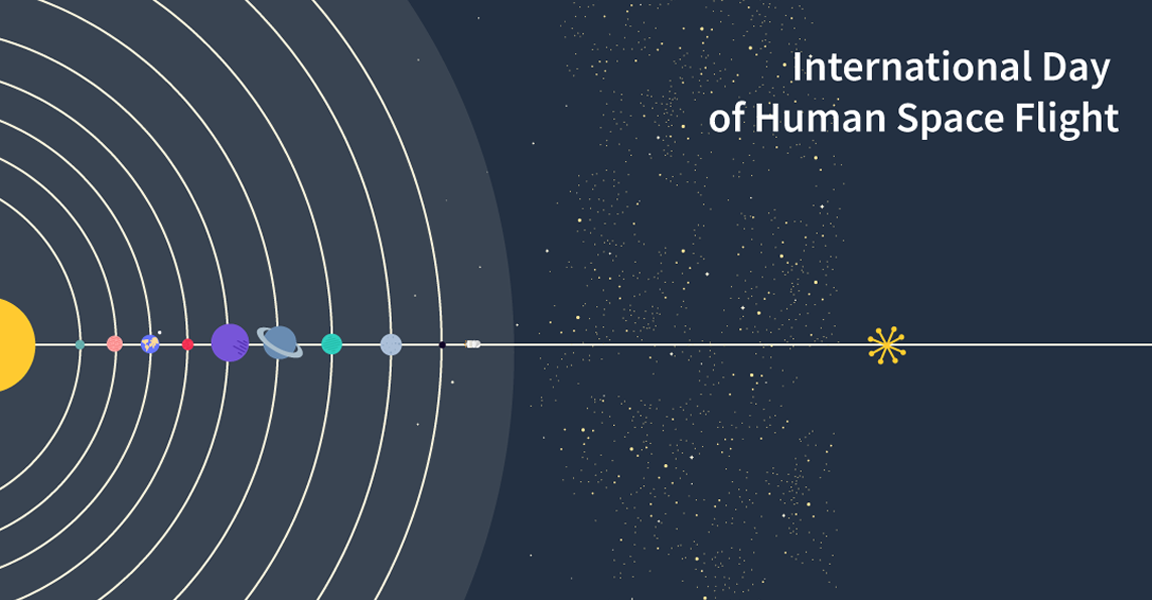
12 April 1961 was the date of the first human space flight. This historic event opened the way for space exploration for the benefit of all humanity. The United Nations family strives continuously to utilize the unique benefits of outer space for the betterment of all humankind.
Explore Data VisualizationVaccinations
March 5, 2021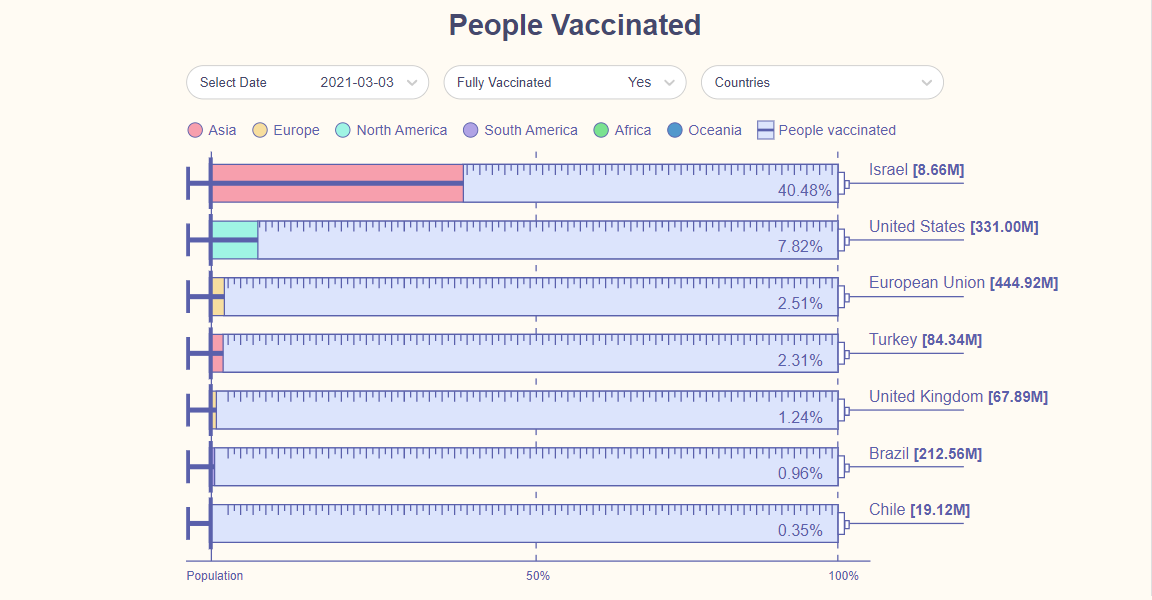
Once a distant possibility, the COVID-19 vaccine has finally started rolling out to most of the corners of the world. In this visualization we attempt to graphically represent this information, merging the wonders of SVG and frontend technologies.
Explore Data Visualization